Finding your way around
The window is the same shape everywhere: a sidebar of domains on the left, a bar across the top carrying the scope you are working in, and one screen in the middle that is either a list or one object’s detail.
The sidebar
Section titled “The sidebar”Domains — Workloads, Network, Config, Storage, Cluster, Helm and the rest — each holding the kinds that belong to them. Settings sits in the footer, next to the command palette.
The scope bar
Section titled “The scope bar”Two controls decide what every screen is showing:
- Context — which cluster. Switching one resets every cluster query, so screens go back to loading rather than showing the previous cluster’s rows while writes already reach the new one. If you are on a detail page, the app takes you back to its list first, because the object you were looking at belongs to the cluster you are leaving.
- Namespace — or All namespaces. The selector lists names only; it never counts pods, because on a busy cluster one such count is megabytes on every refresh.
The command palette
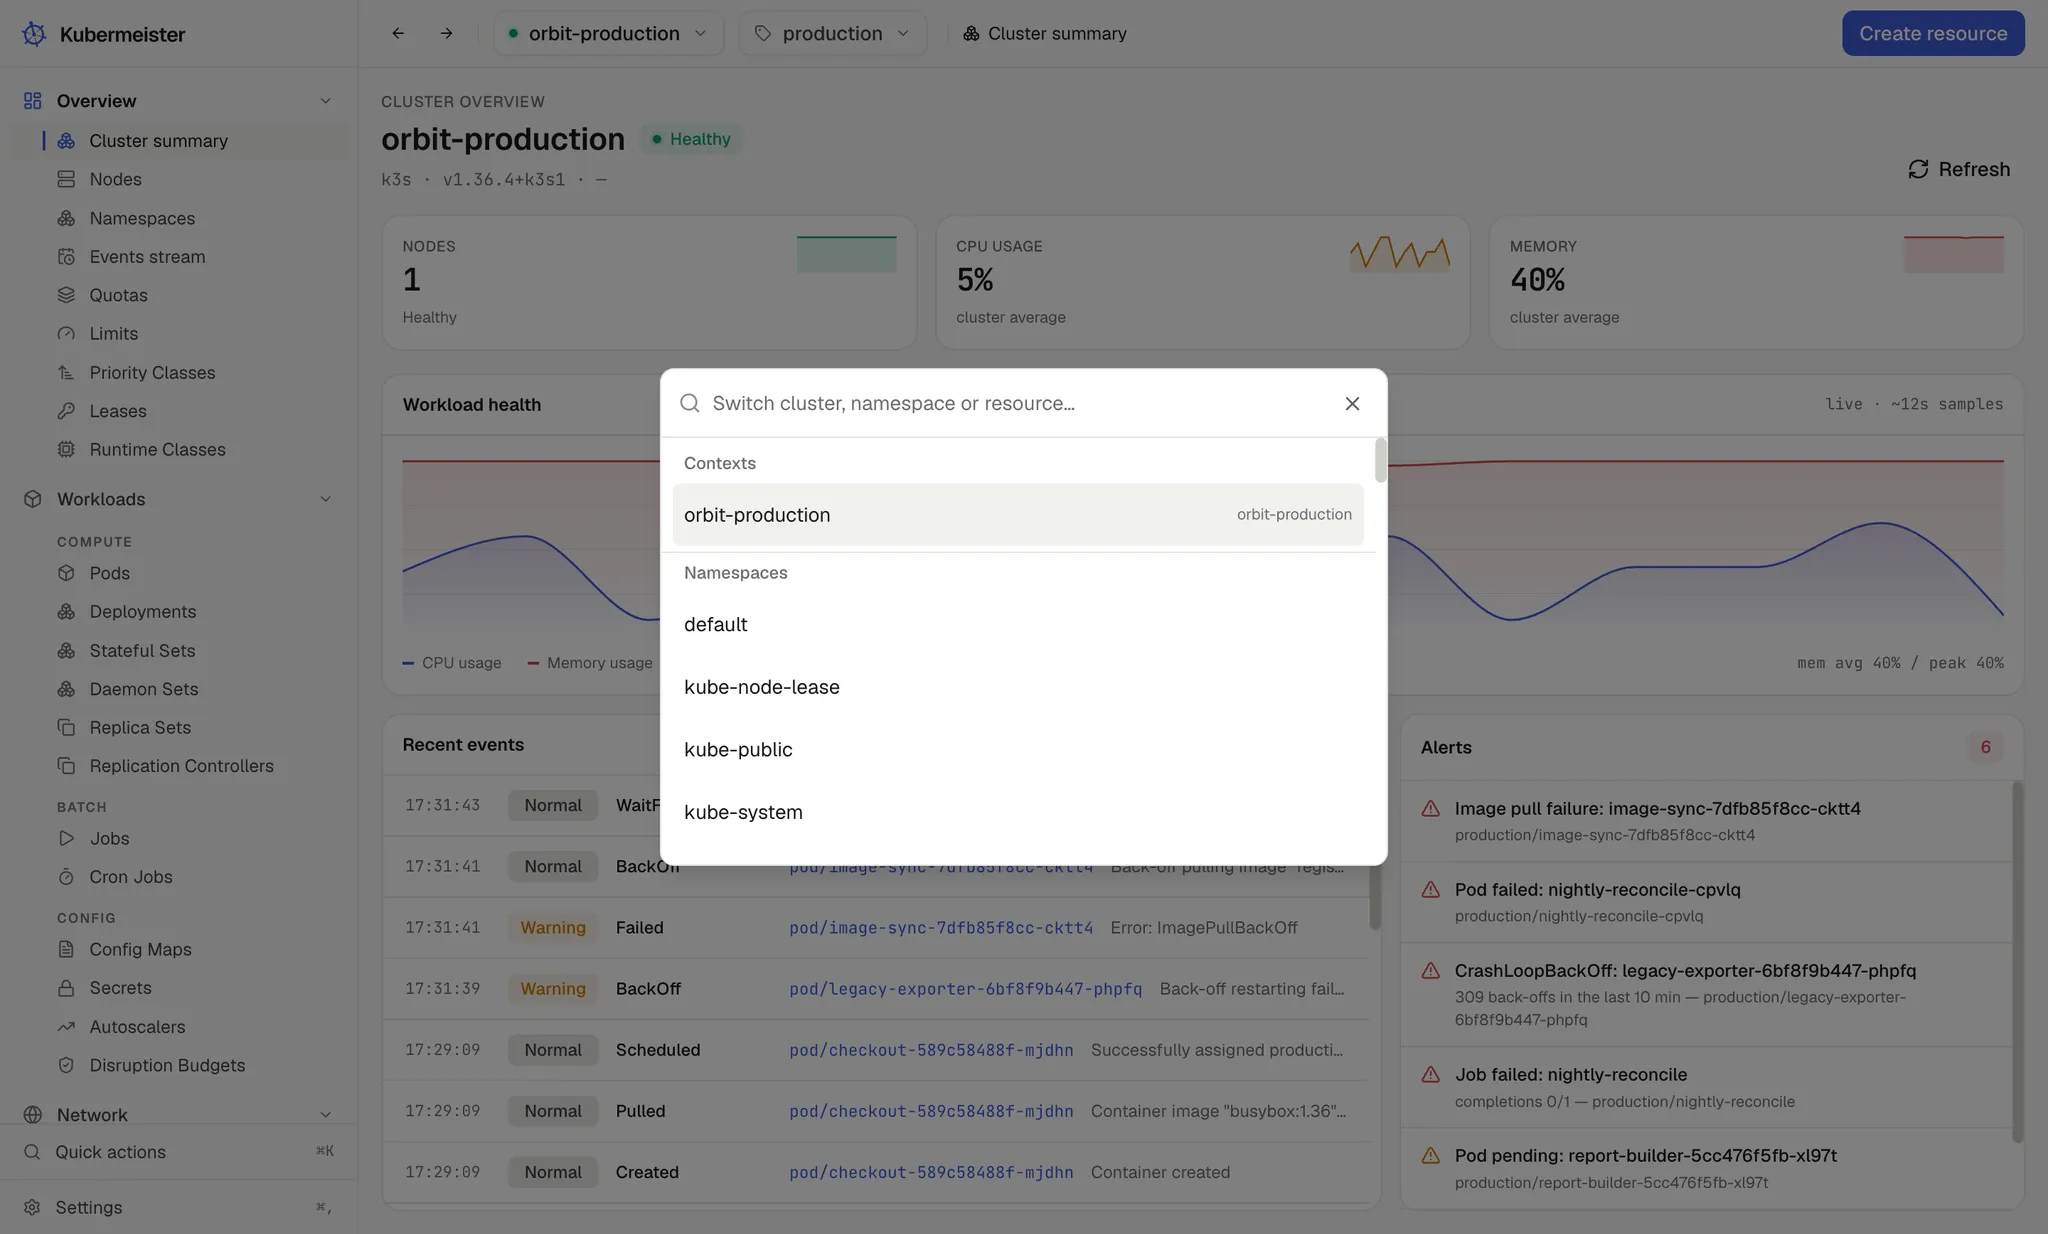
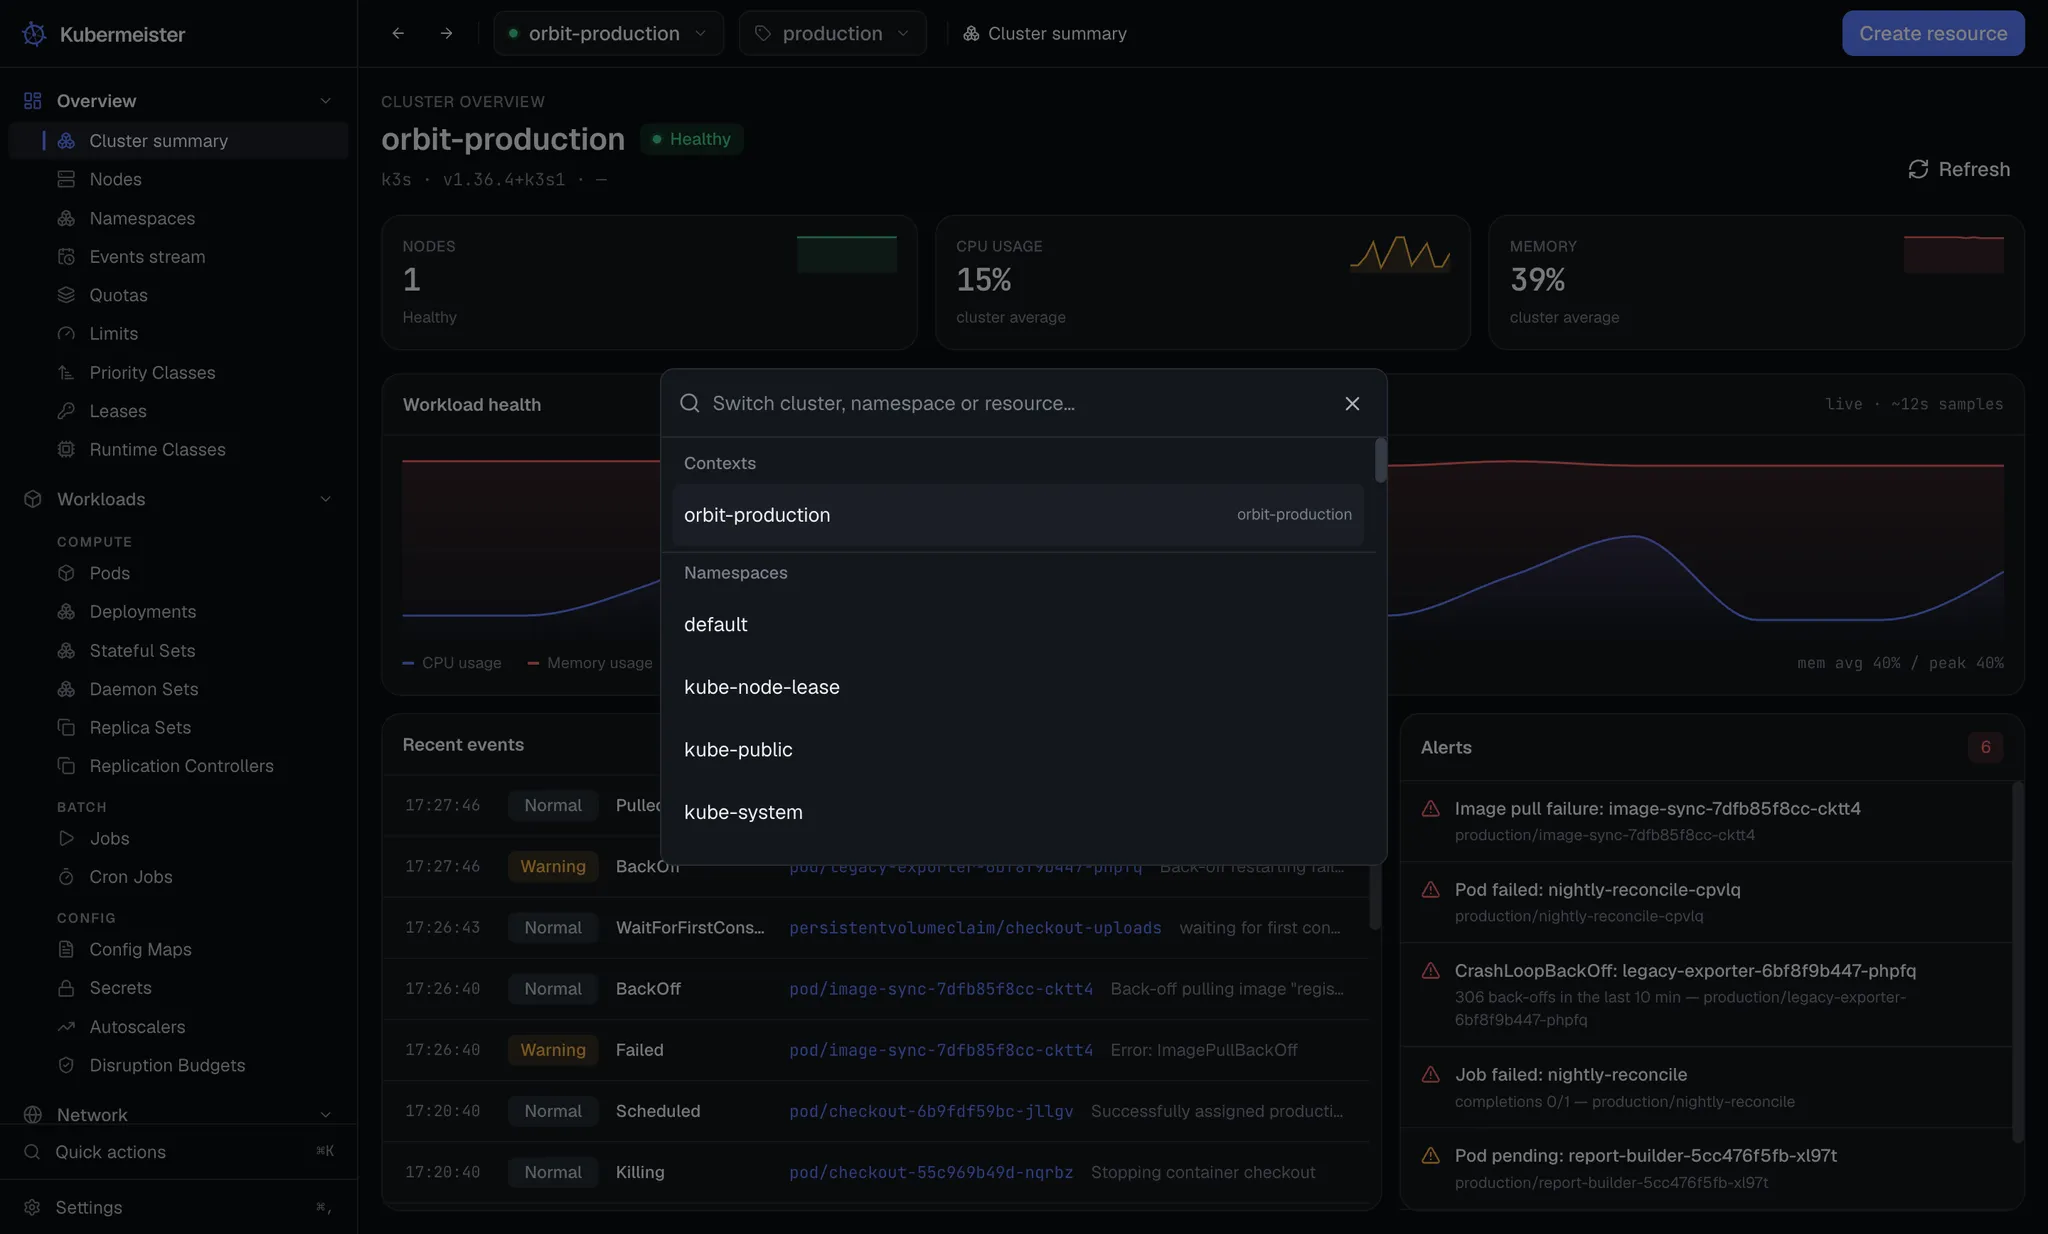
Section titled “The command palette”⌘K on macOS, Ctrl K elsewhere. It reaches every screen, the context and namespace selectors, and
the update check.
List screens
Section titled “List screens”A list asks for one thing: its kind, in its namespace. The search box narrows the rows already on screen against the columns on screen — nothing about it reaches the API server, so it is instant and costs the cluster nothing.
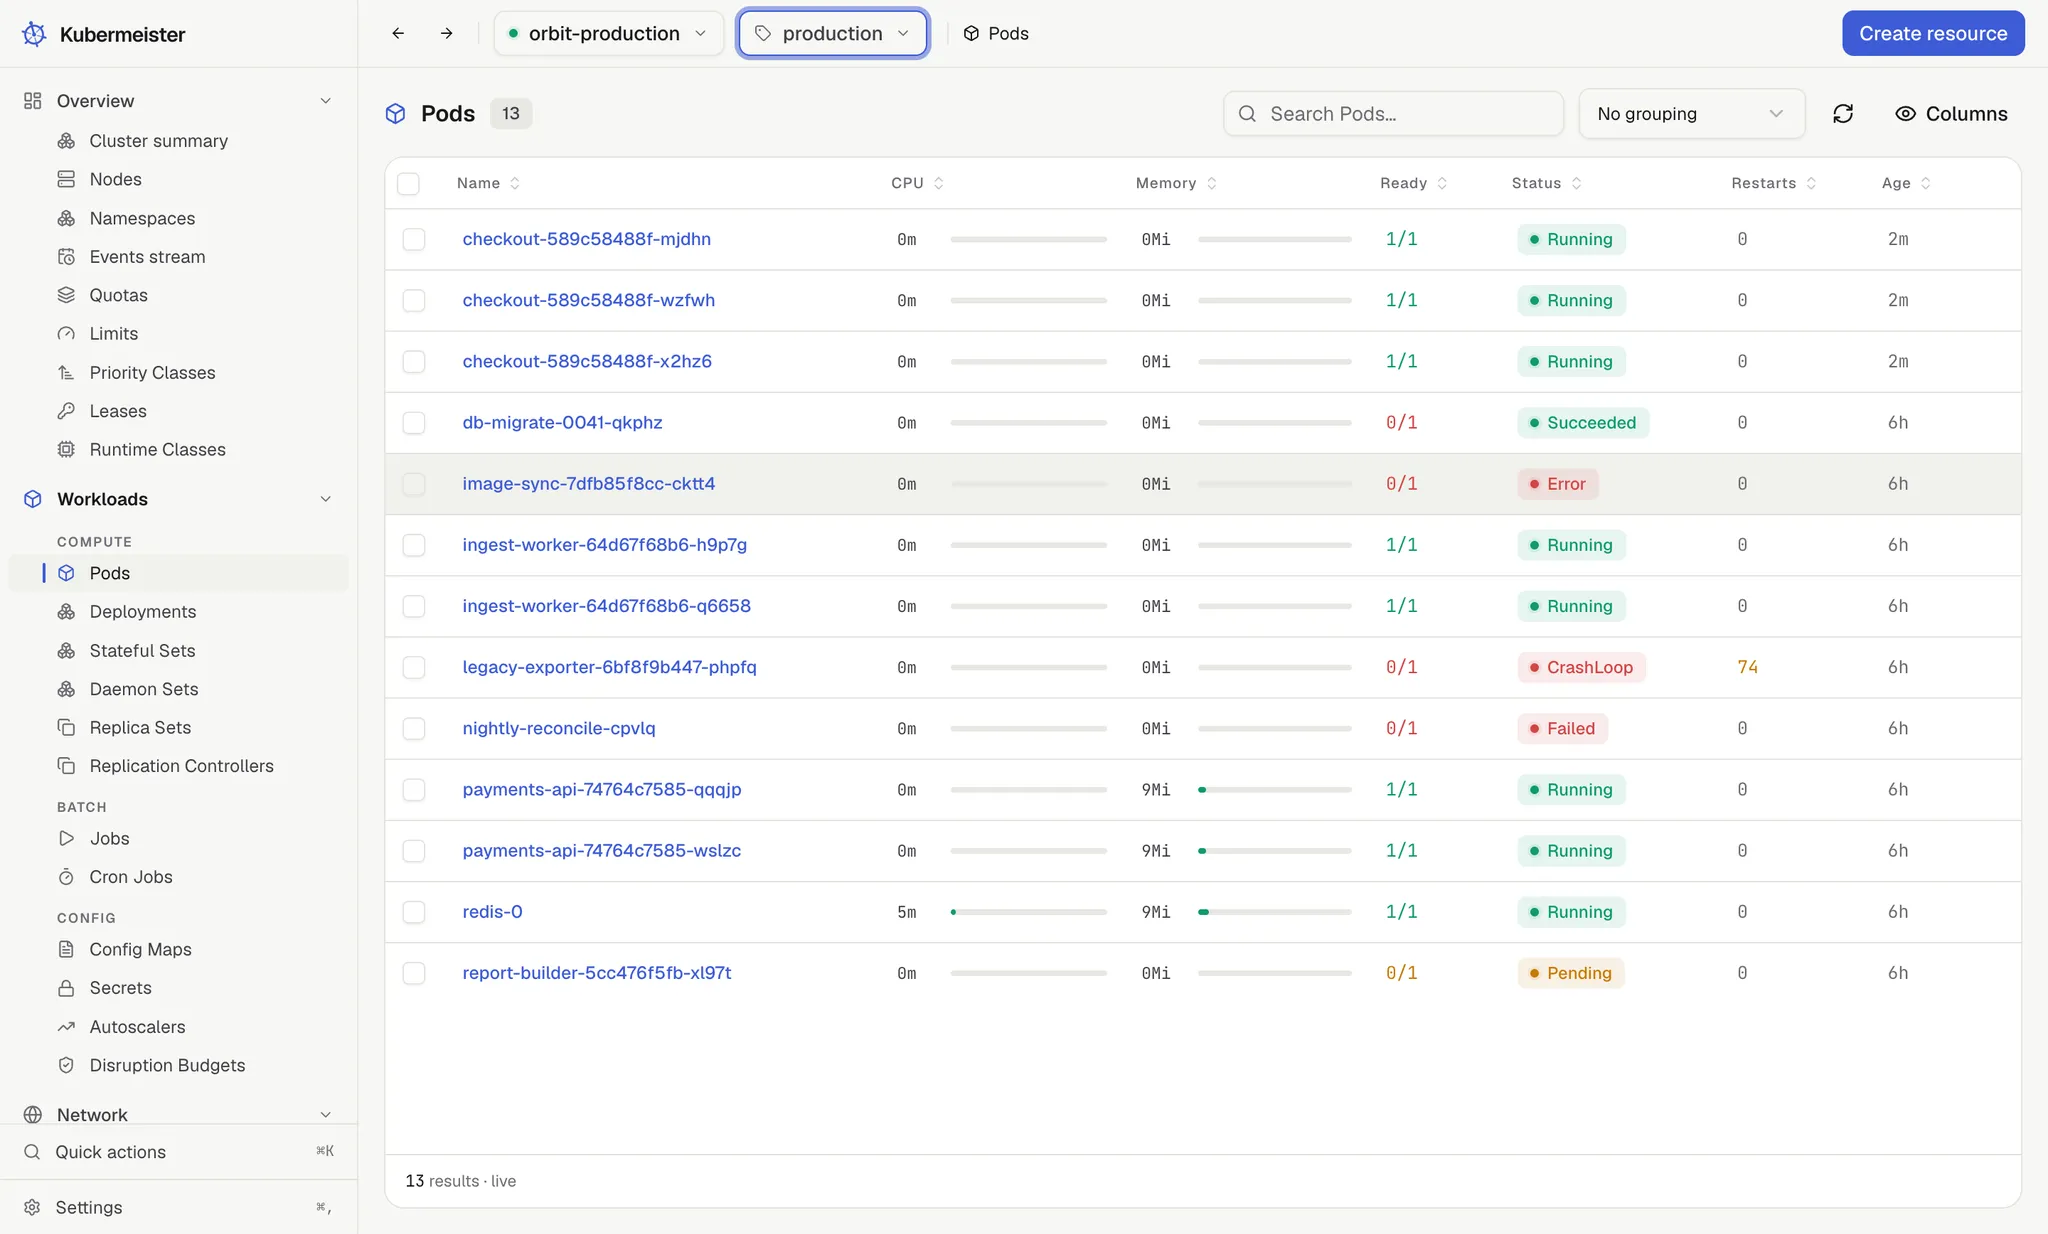
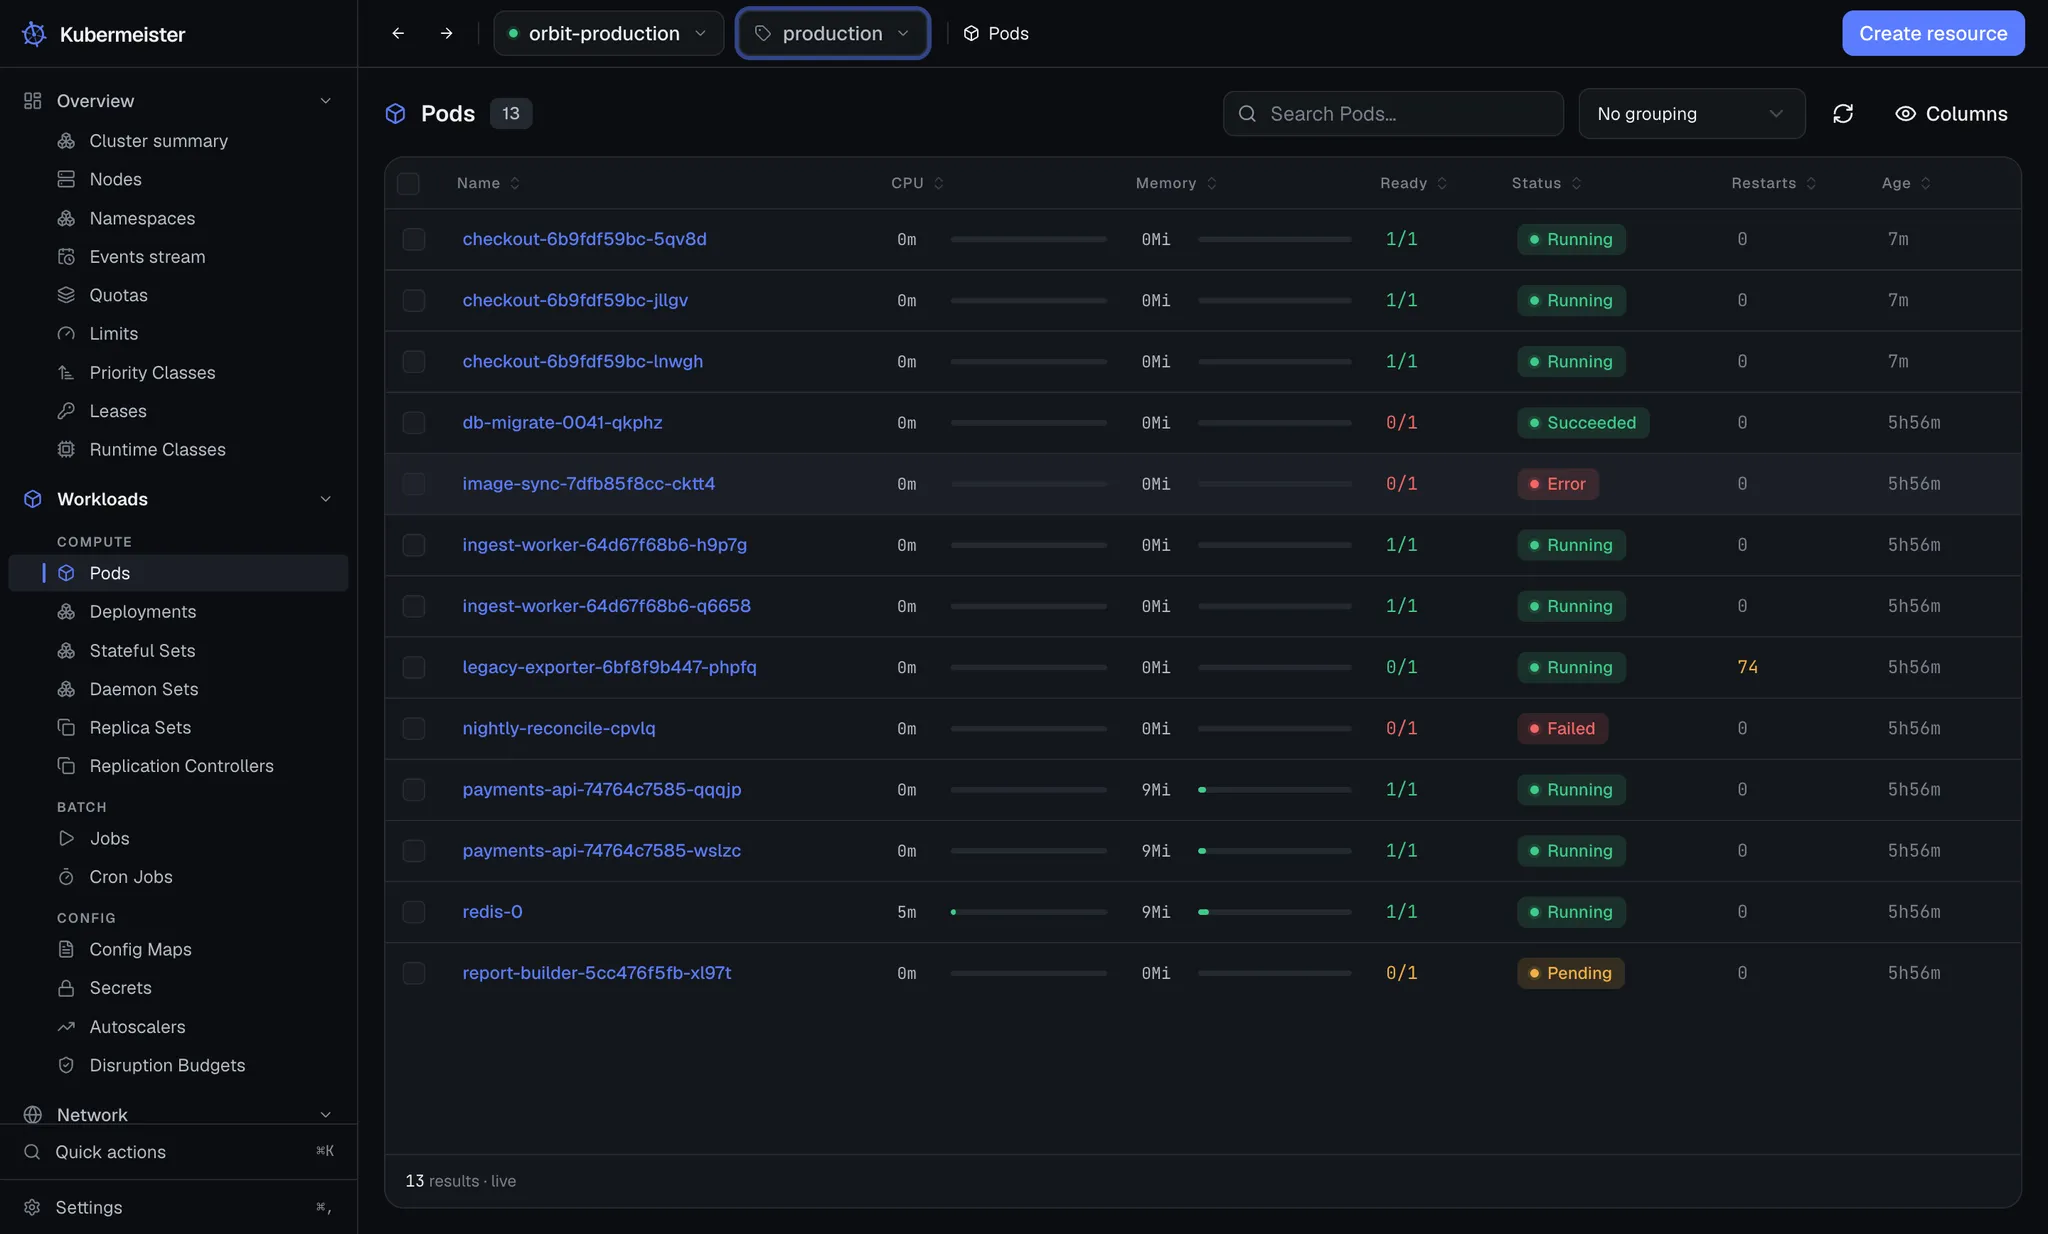
Which columns you see is a preference about this window, stored locally per screen. Rows render only where they are in view, so a list costs the size of your window rather than the size of your cluster.
Detail screens
Section titled “Detail screens”One header over a left rail of tabs, grouped by what they are for:
- Observe — overview, events, logs, metrics.
- Inspect — labels and annotations, the manifest, describe, related objects.
- Connect — shell, port forwards.
Panels that hold a live session, like Logs, stay mounted when you switch tabs so a follow survives. The Shell tab deliberately does not, so merely opening a pod’s page never execs into it.
Browsing resources goes into what a list screen can do.