Reading logs
A Logs tab opens already following. A log is opened to see what is happening now, and a console you have to switch on first is a step in front of the answer.
Pod logs
Section titled “Pod logs”The tab starts live, showing the same tail the one-shot read would. Turning Live off switches to that snapshot, which is what holds the view still while you read.
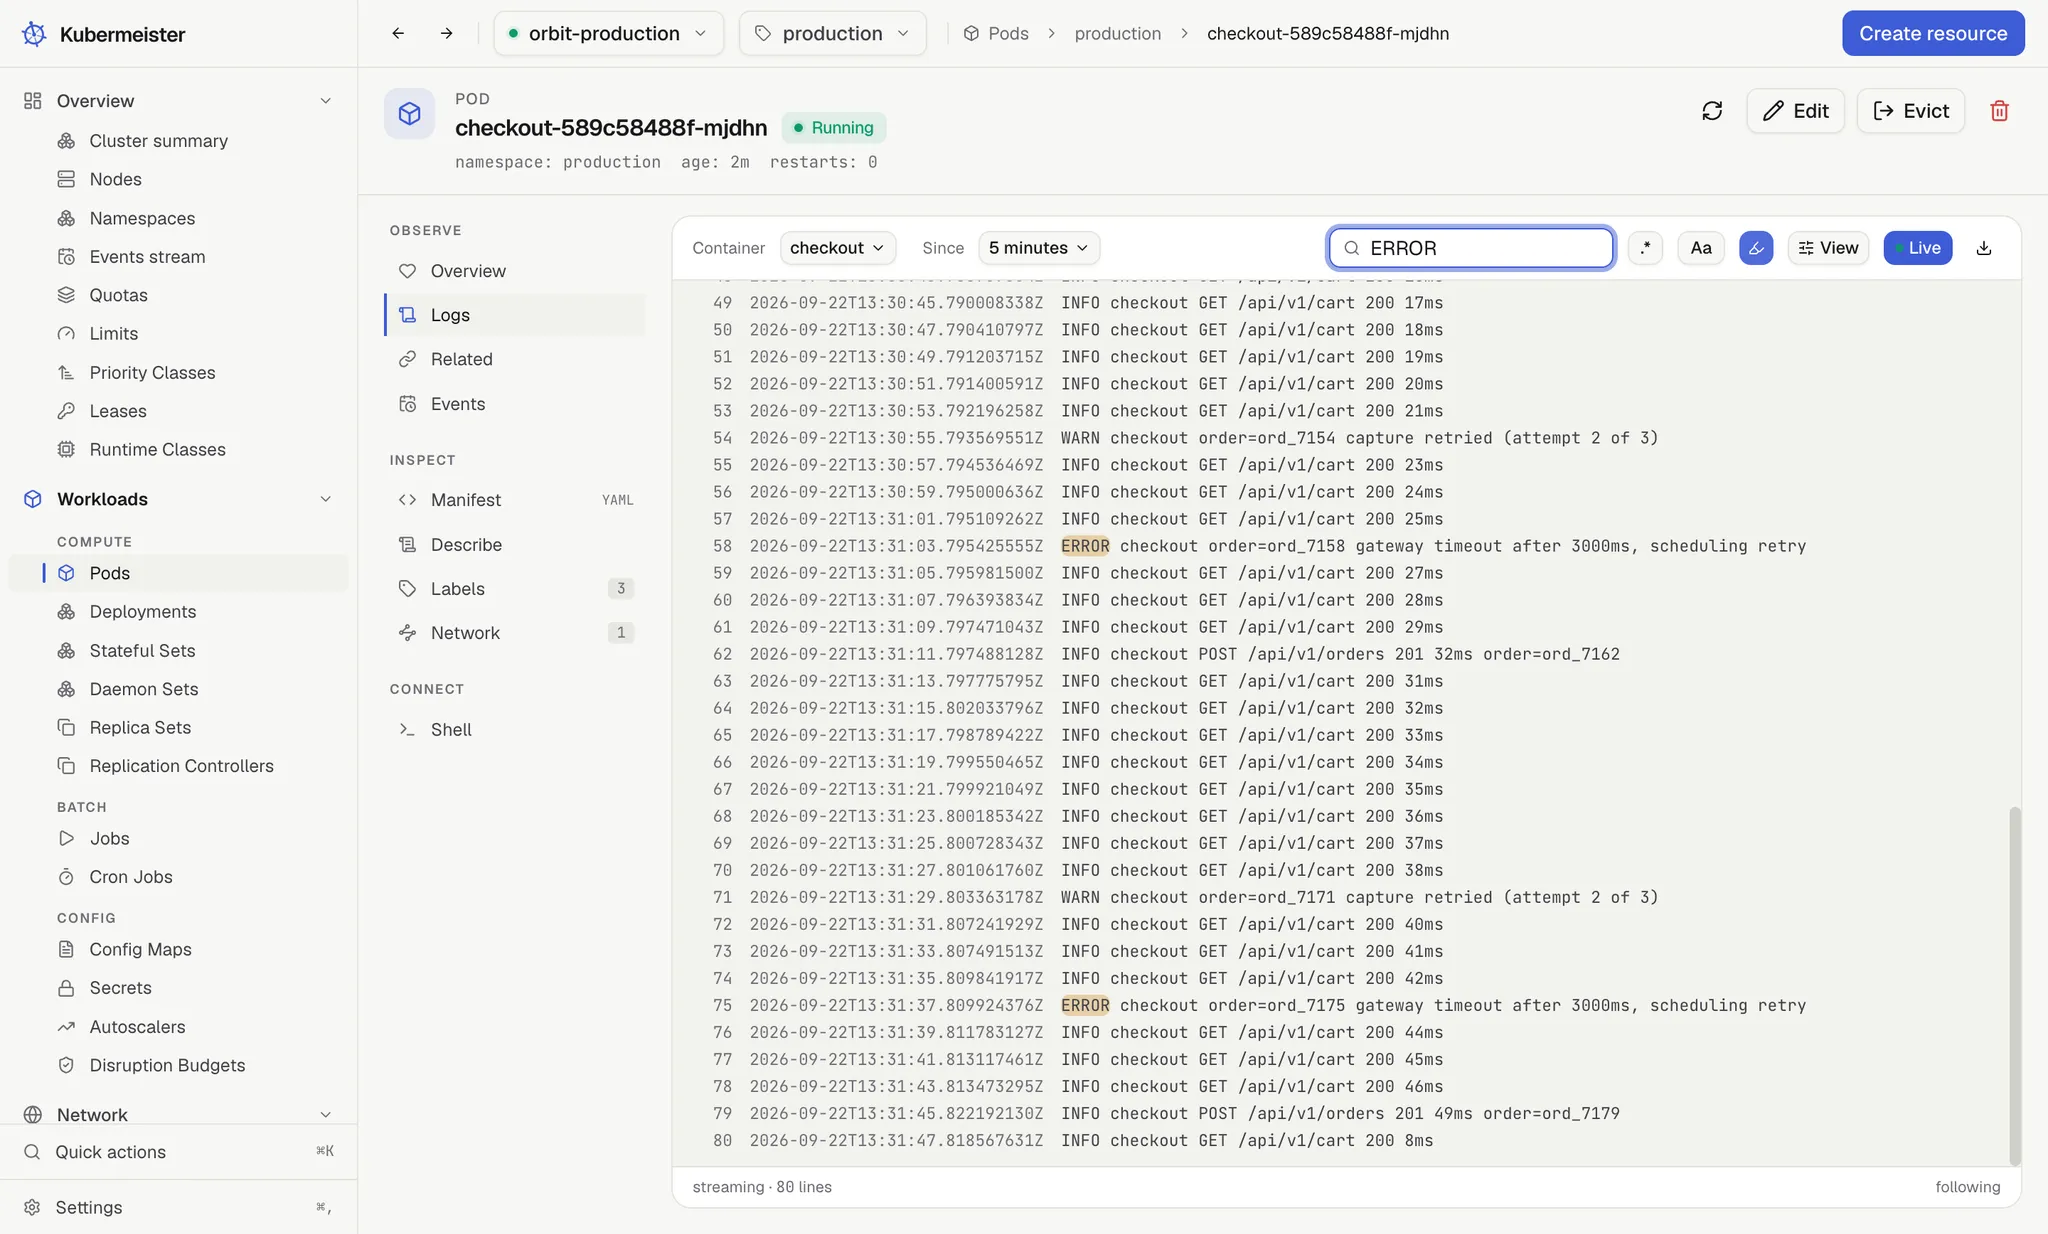

The tab stays mounted when you move to another tab of the same pod, so a follow survives — and it ends when you leave the page.
Workload logs
Section titled “Workload logs”A controller’s Logs tab follows every pod it owns at once.
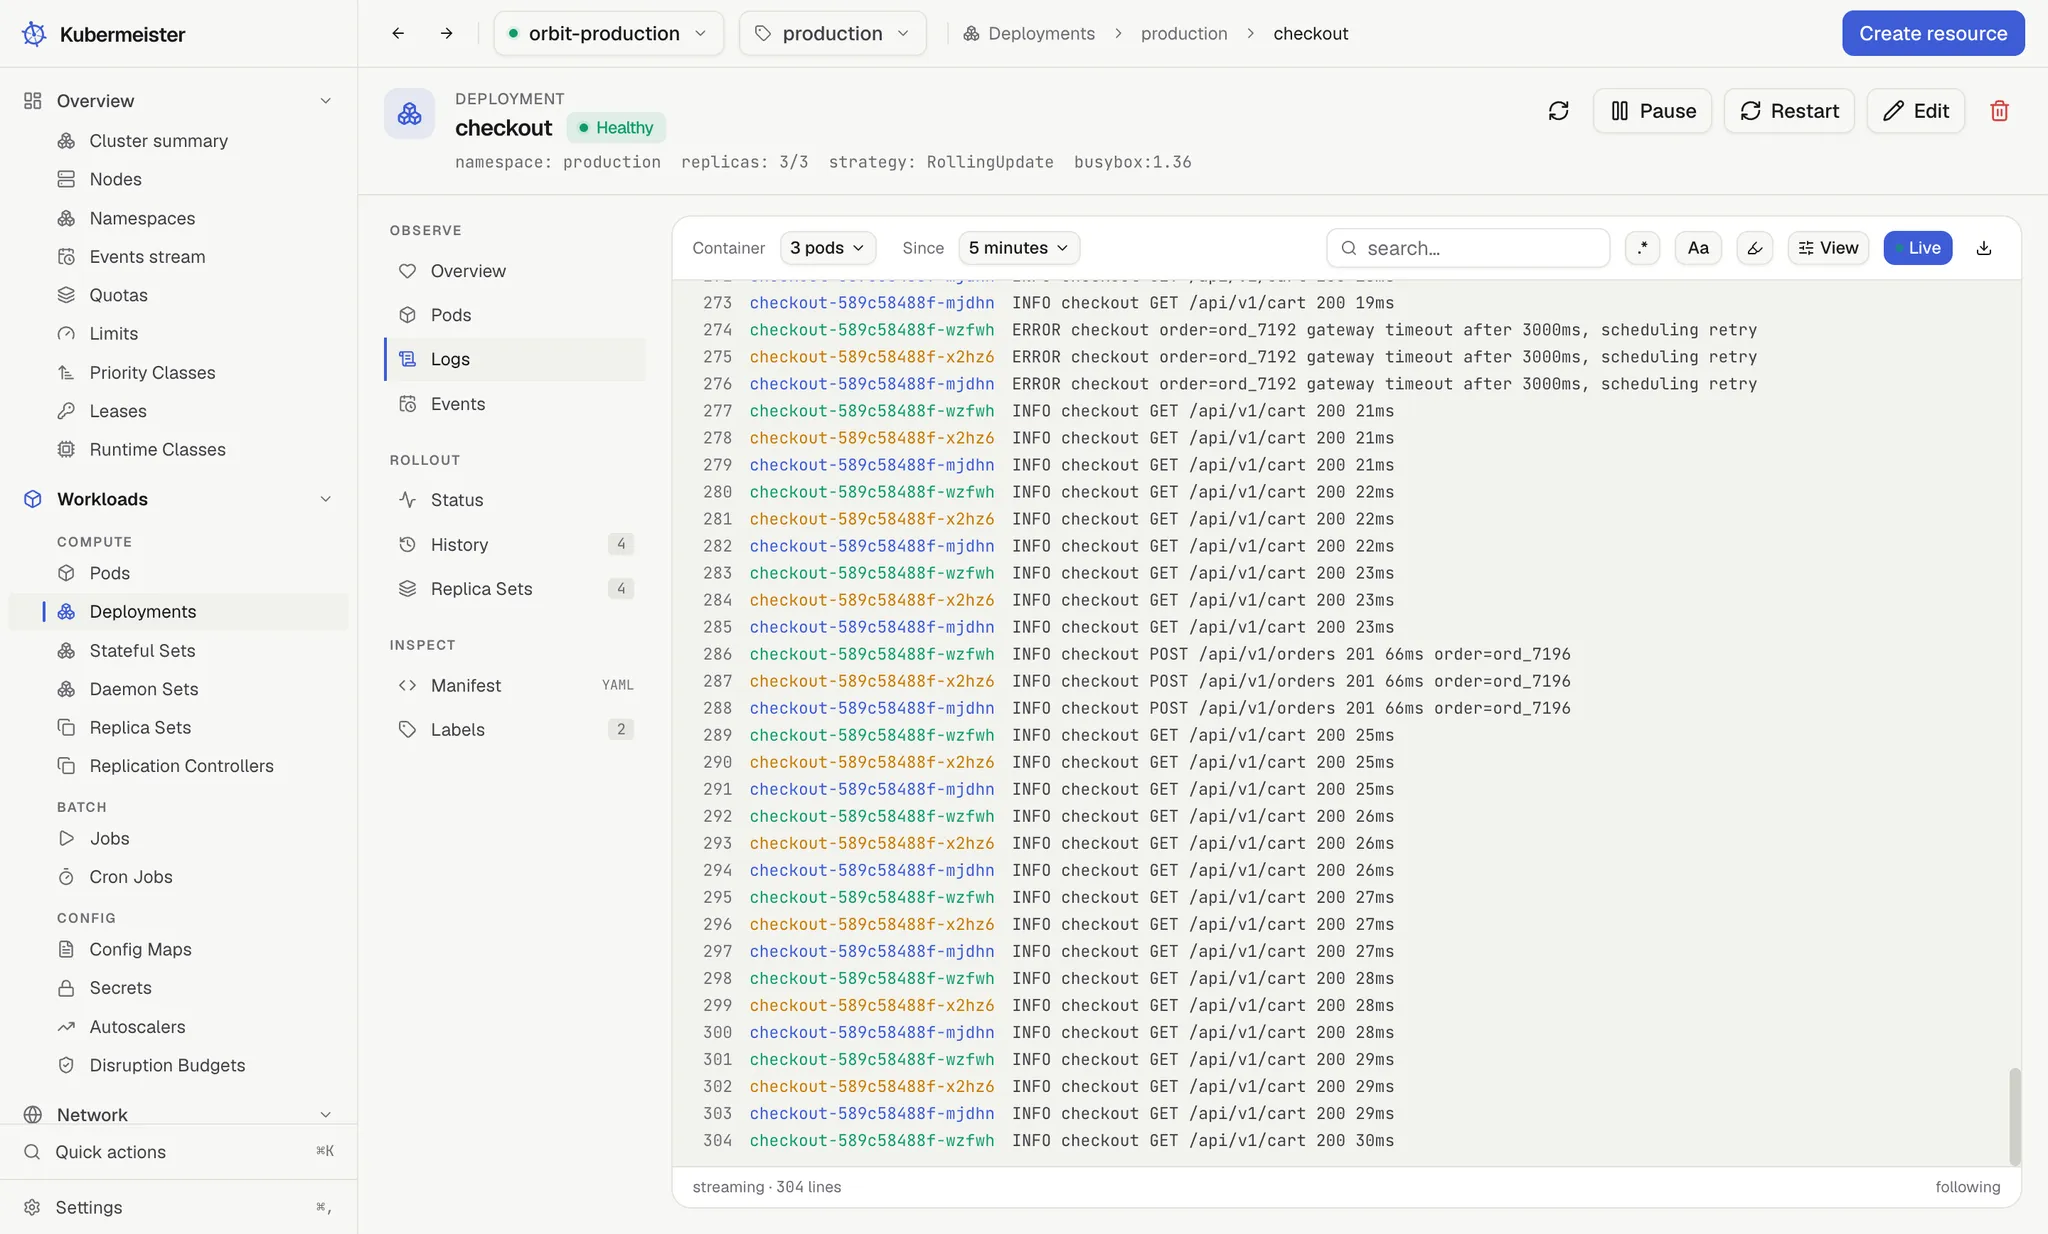
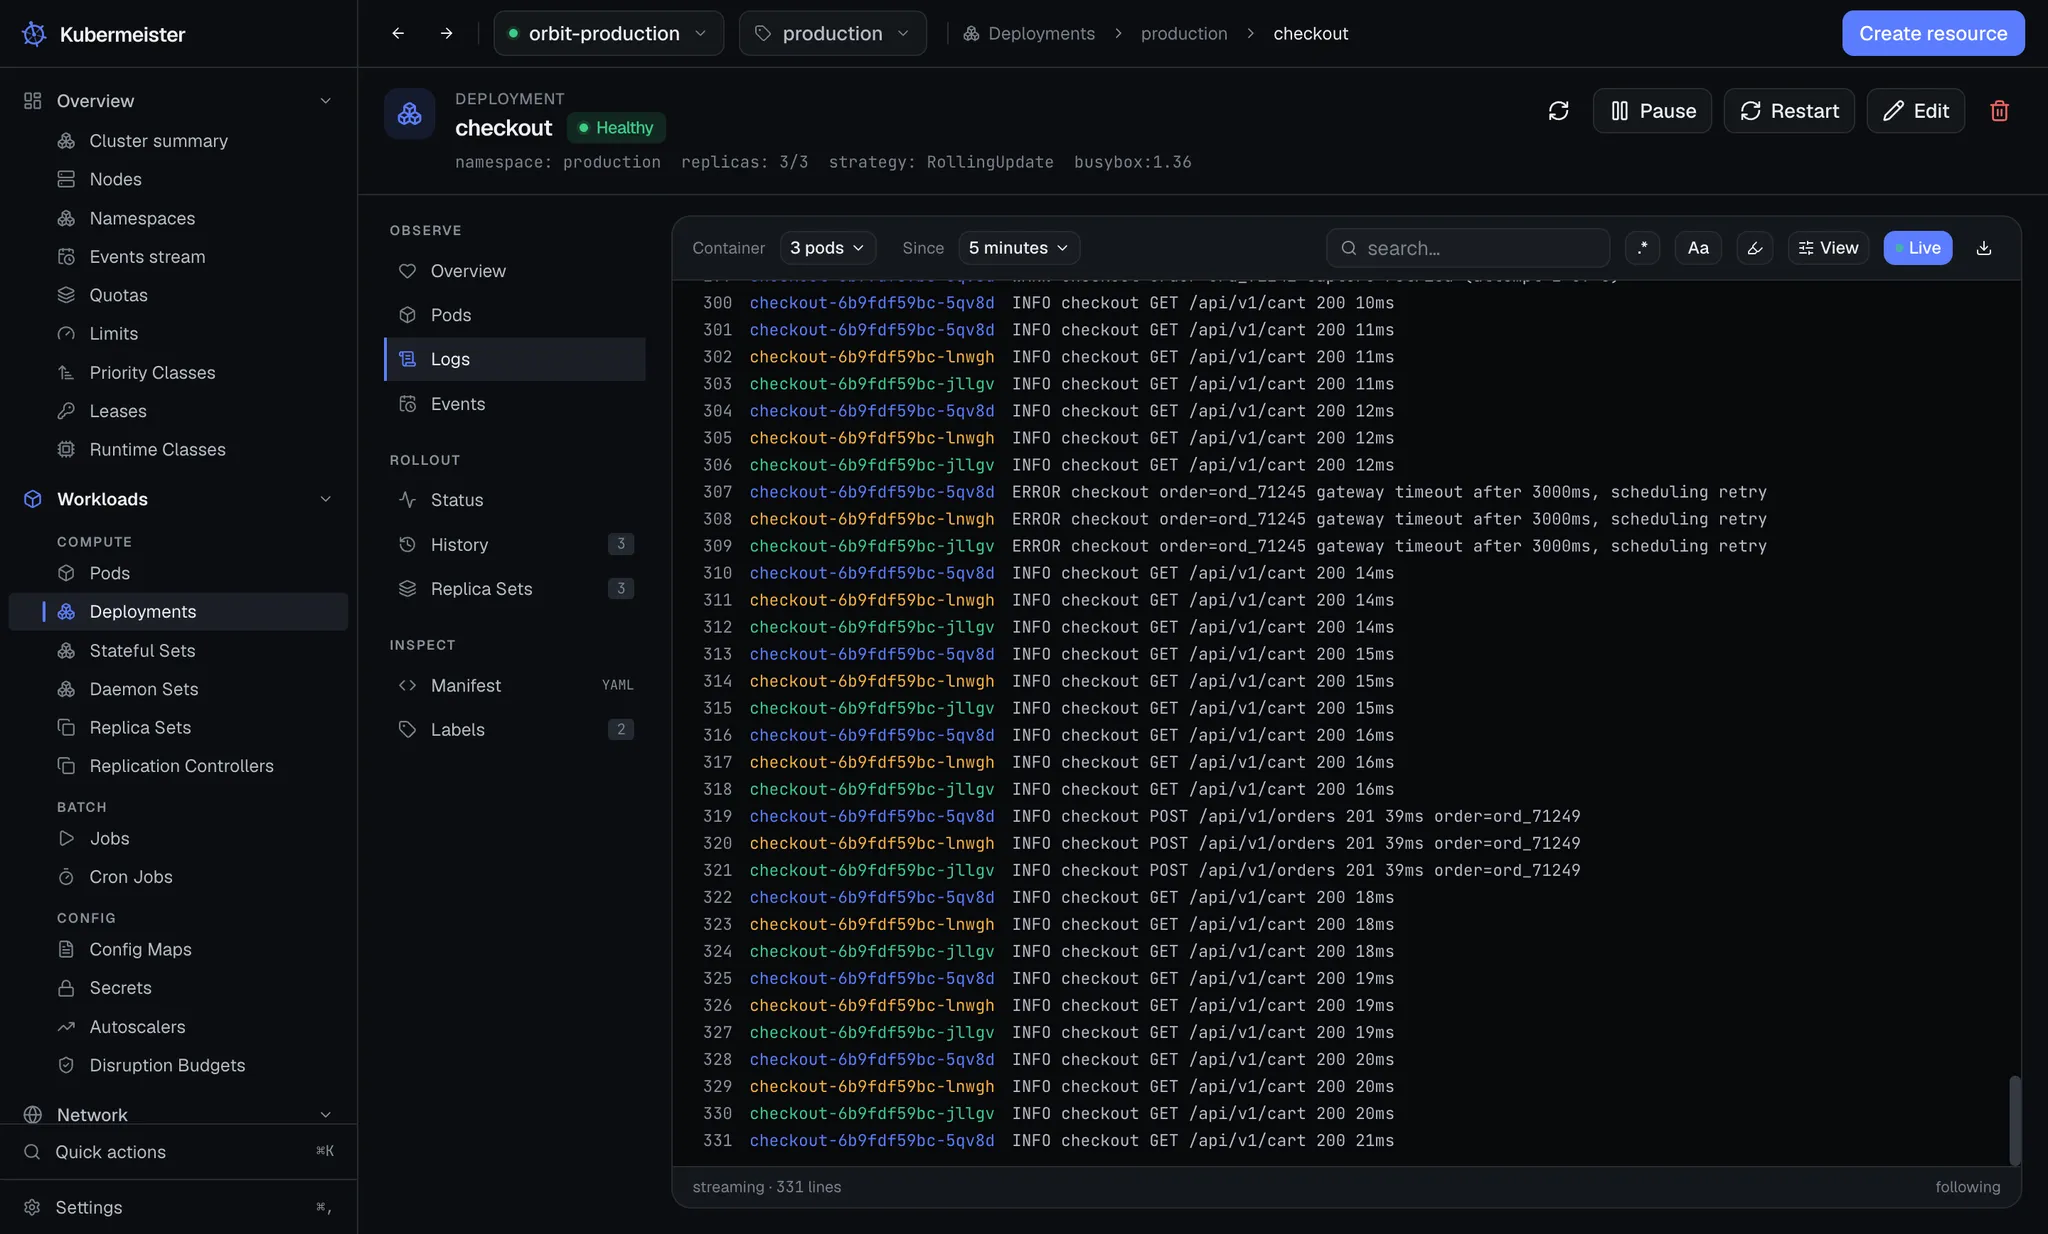
There is no API call for “the logs of this deployment”, so the app opens one stream per pod, merges them in arrival order and colours each line by pod. When the set of pods changes, the follow restarts, so a replaced pod stops being followed and a new one starts.
Filtering
Section titled “Filtering”Search is in the toolbar, with .* for regex and Aa for case sensitivity.
- By default the search narrows the console. A line the search misses is gone, not merely unhighlighted.
- Highlight is the other mode: every line stays and matches are marked where they sit, which is often the only way a hit is legible. Its toggle is the highlighter icon beside the regex and case toggles, because it modifies the search.
- An unfinished regular expression reads as “no filter yet” rather than emptying the console mid-keystroke.
The toolbar and the View menu
Section titled “The toolbar and the View menu”The toolbar is one row, and what stays on it decides which lines are shown: the container, the since window, the search and Live.
How those lines are read sits behind the View button — wrapping, timestamps, the tail size. Those are preferences about the window rather than the cluster, so they are stored locally and shared by every console rather than kept per screen.
Timestamps and tail
Section titled “Timestamps and tail”Both defer to the screen until you say otherwise:
- A pod reads 500 lines and stamps each one.
- A workload reads 100 lines per pod and does not stamp them, since its rows already spend a column naming the pod.
Touch the switch in the View menu and your answer applies on every console from then on.
Buffer size
Section titled “Buffer size”The console keeps a bounded buffer — 2,000 lines by default for a pod stream, with the size set in Settings → Data. It is read live, so raising it trims differently from the next batch on rather than restarting the follow.
Only the rows in view are rendered, so tens of thousands of lines cost a screenful of DOM.
Downloading
Section titled “Downloading”Download saves the whole log from the API server, not the buffer on screen. It is capped in the app and cut on a line boundary, so you never get half a line at the end.