Usage metrics
Usage comes from metrics-server, through a sampler inside the app.
How it works
Section titled “How it works”Every 12 seconds the sampler reads pod and node usage plus the node list, and keeps bounded ring buffers: one for the cluster aggregate, one per node, and up to 40 for pods somebody is actually looking at.
It starts lazily when a reader needs it, resets on a context switch, and stops when the app quits.
Where the numbers show up
Section titled “Where the numbers show up”Pod and node rows take their CPU and memory from the latest sample, so a listed row and a watched row always agree. Detail screens add charts over the buffer, and a Deployment’s series is the sum of its selected pods’.
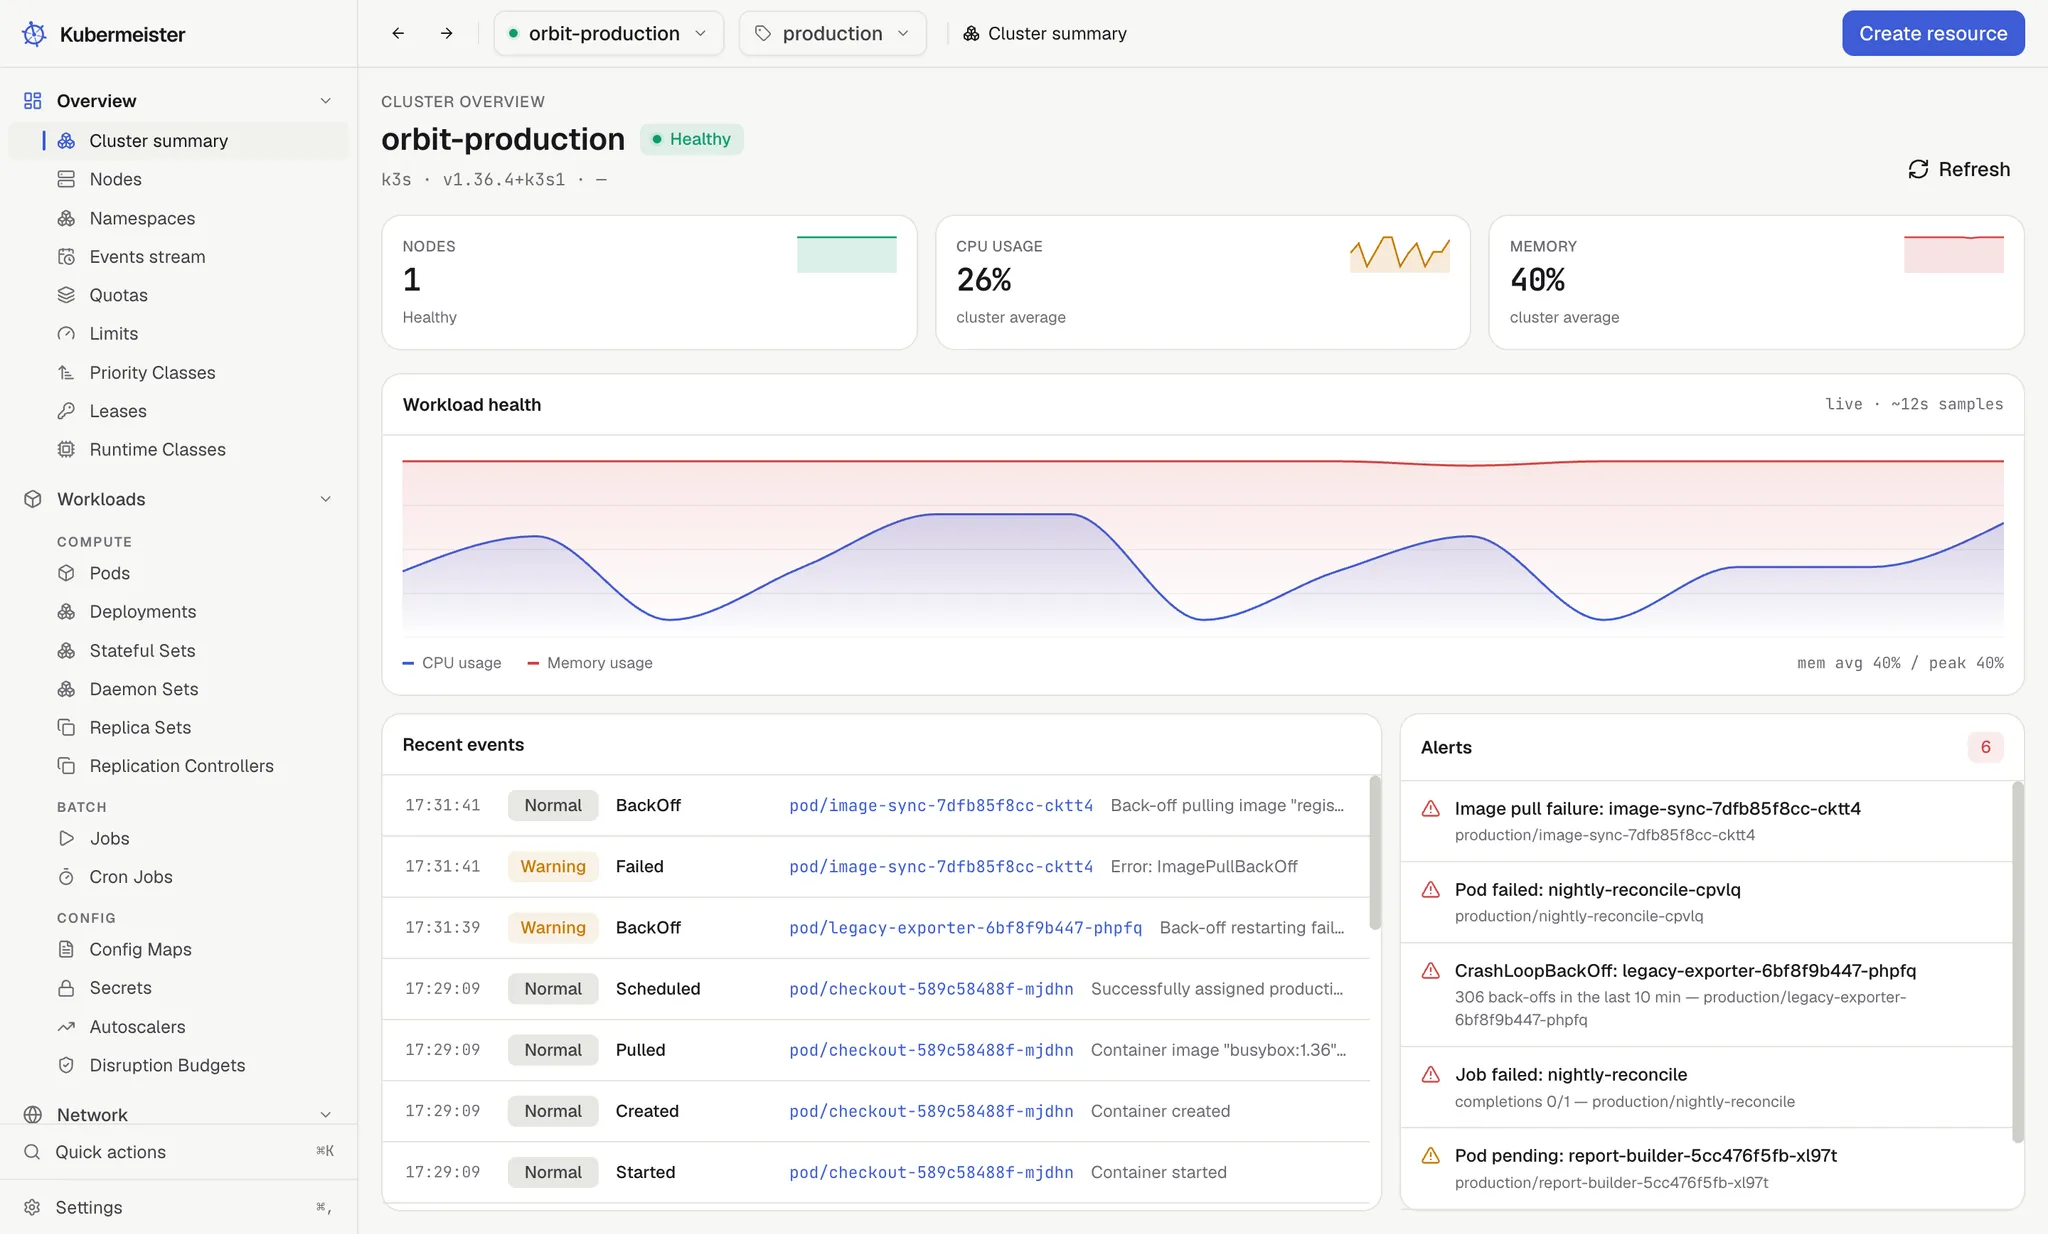
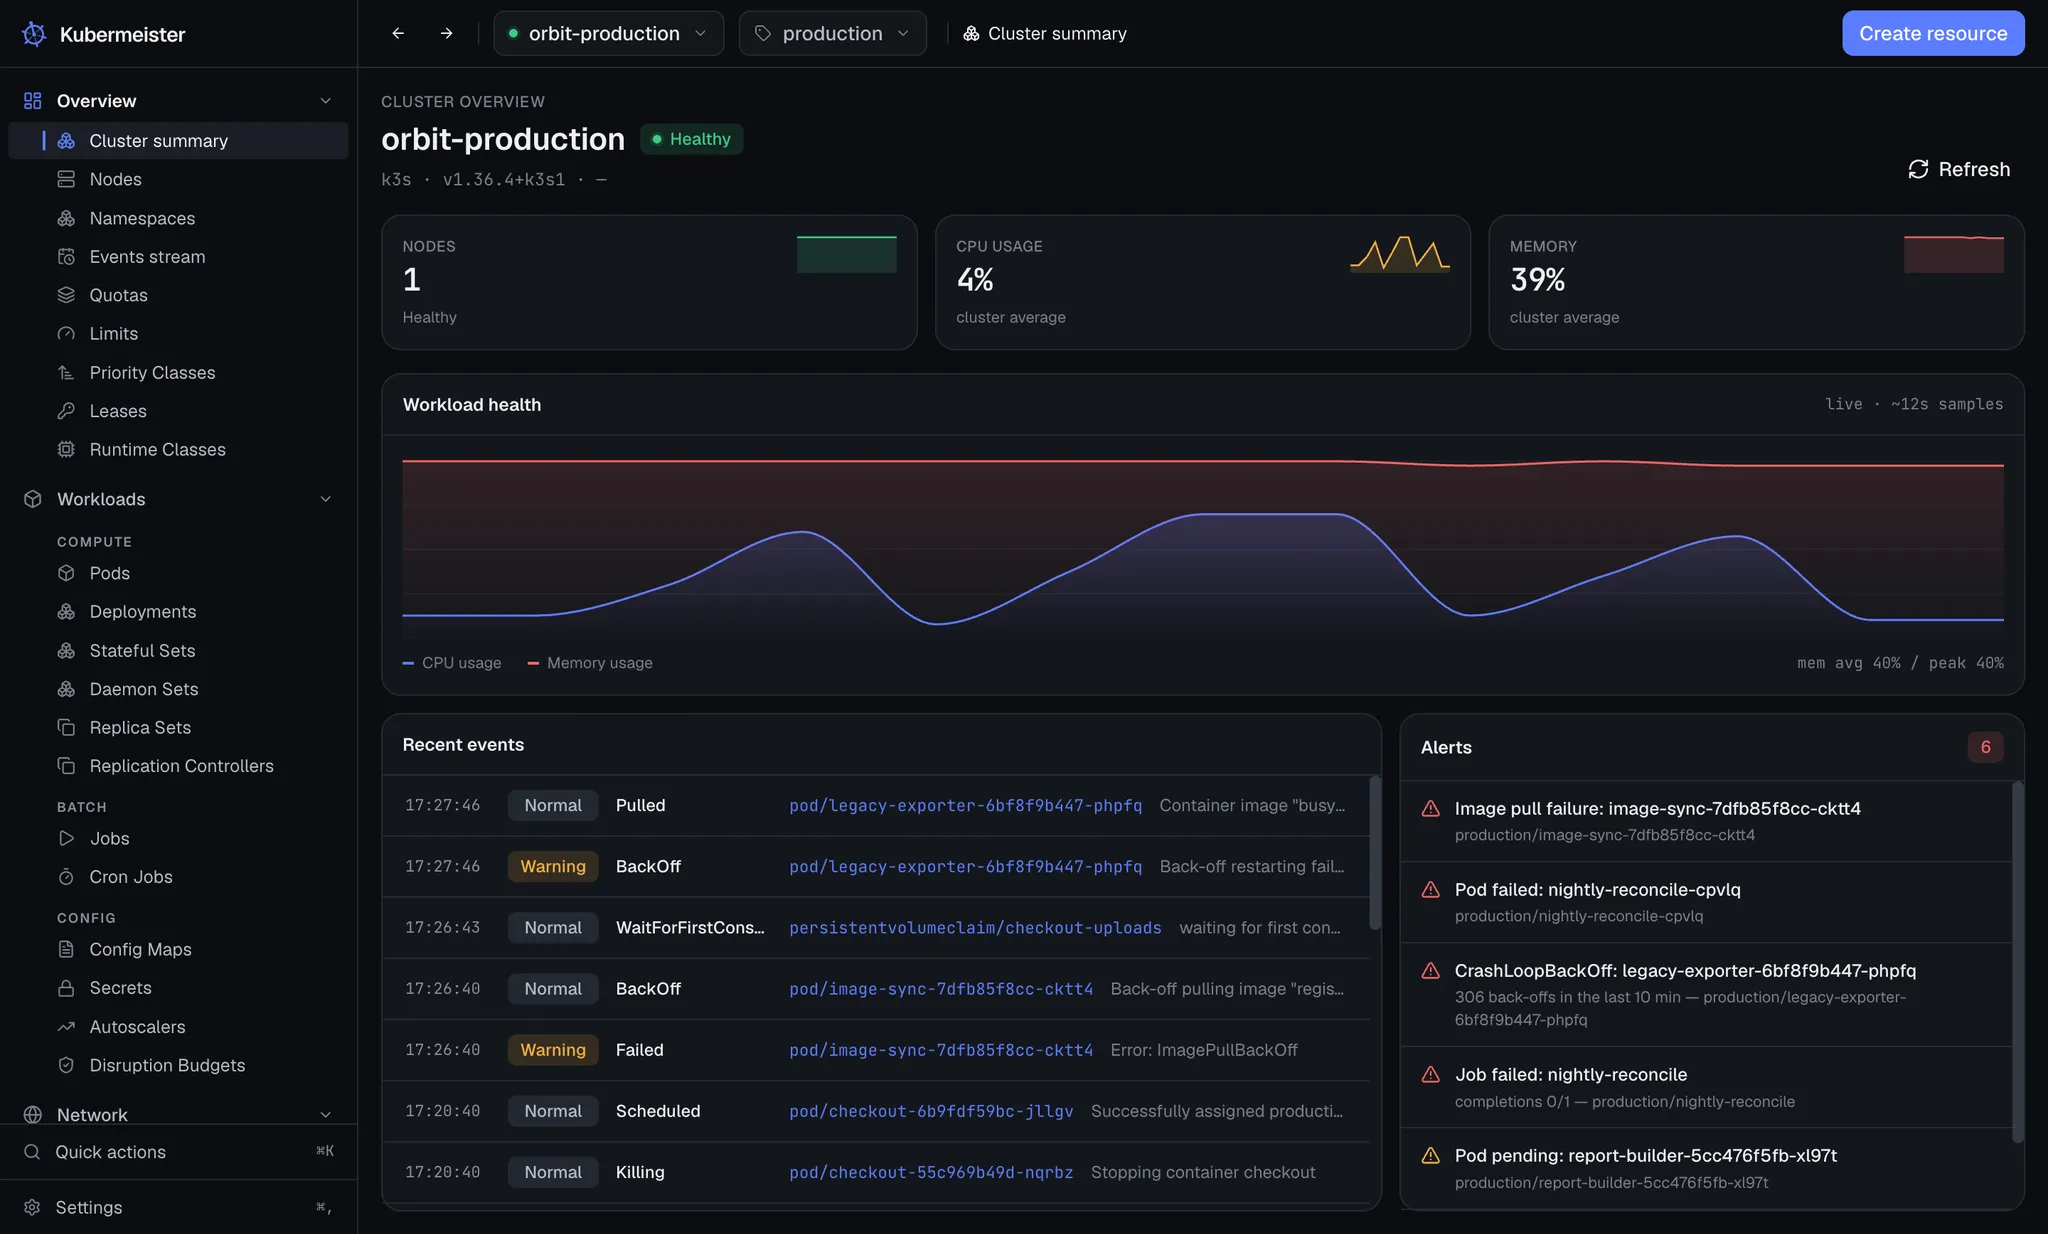
Per-container figures sit beside each container’s requests on the pod screen. Both the pod totals and the per-container numbers are read once, so the two cannot disagree — and requests travel as numbers as well as strings, so nothing has to parse a Kubernetes quantity on screen.
No metrics-server
Section titled “No metrics-server”A cluster without metrics-server shows zero usage and empty series, never an error page. Usage is an enhancement, not a dependency.
The charts are honest about their history
Section titled “The charts are honest about their history”The sampler is in memory on purpose. Its buffers start empty on every launch and reset when you switch context, so a chart shows what has happened since you opened the app — and never claims history it does not have.
If you want long-term history, that is what Prometheus is for. This is for the last few minutes, right now.